UB1000 P2 Chengdu China Business Trip Report — Zeiss EVO 18 SEM (2016-09-02)
Contents
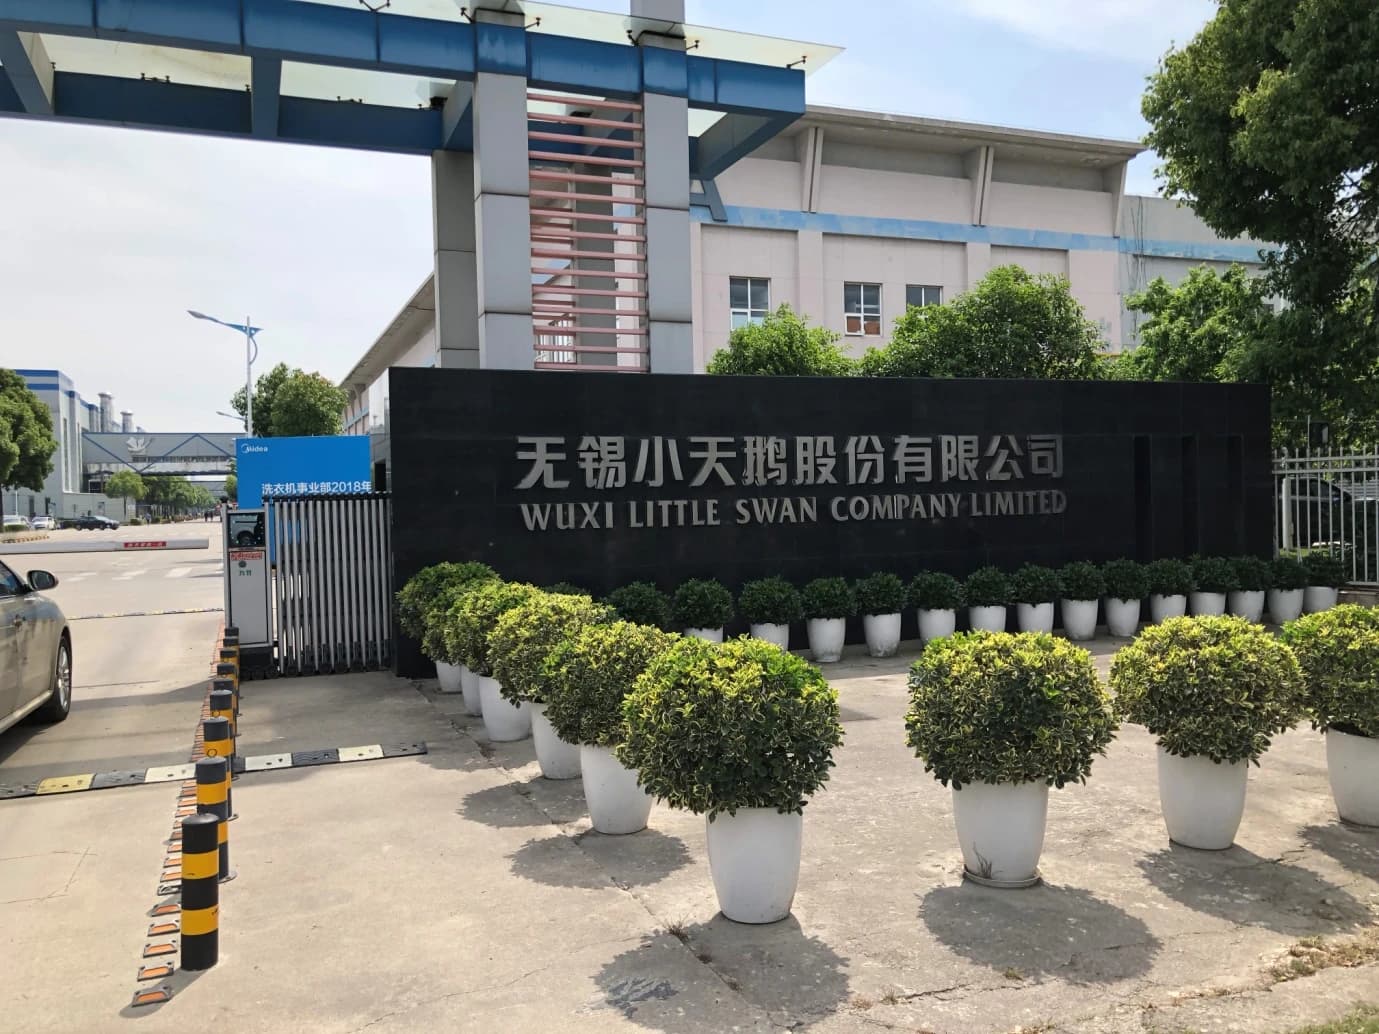
China business trip report (UB1000_P2 Set up)
Target equipment – EVO 18 ( ZEISS SEM )
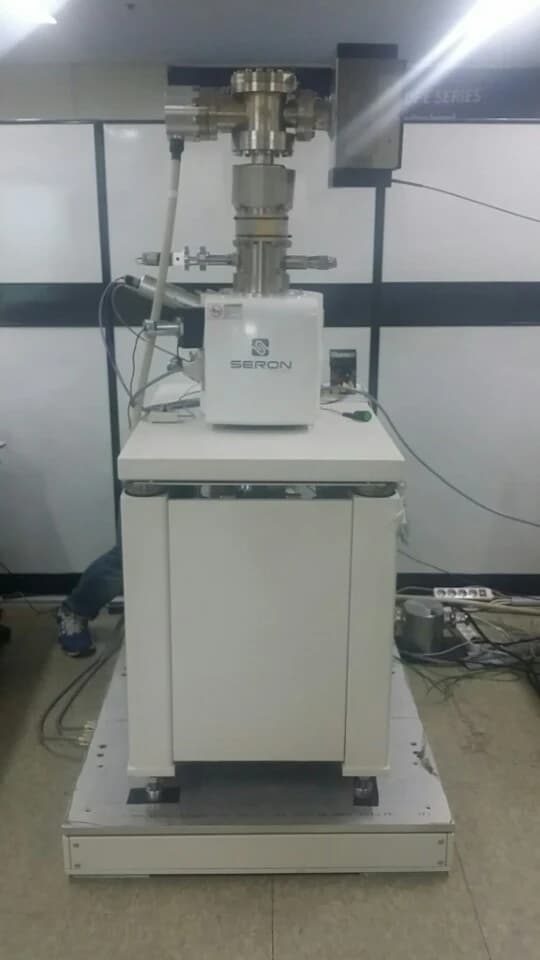
Equipment setup photograph
Business trip dates: 16.08.30 ~ 16.09.01
Travelers: CHOI HYOUNGMUN, LIM JONG UK
Report written: 2016.09.02
Business trip schedule
16.08.30
Departure; arrival in Chengdu, China
16.08.31
UB1000_P2 setup
Equipment image verification
Vibration environment measurement and customer response
16.09.01
Additional equipment installation, performance re-measurement. Good performance.
Return
Installation results summary
| Test Direction | VC-Class | |
|---|---|---|
| Base | Top | |
| ACTIVE | Z | B |
| X | E | |
| Y | D | |
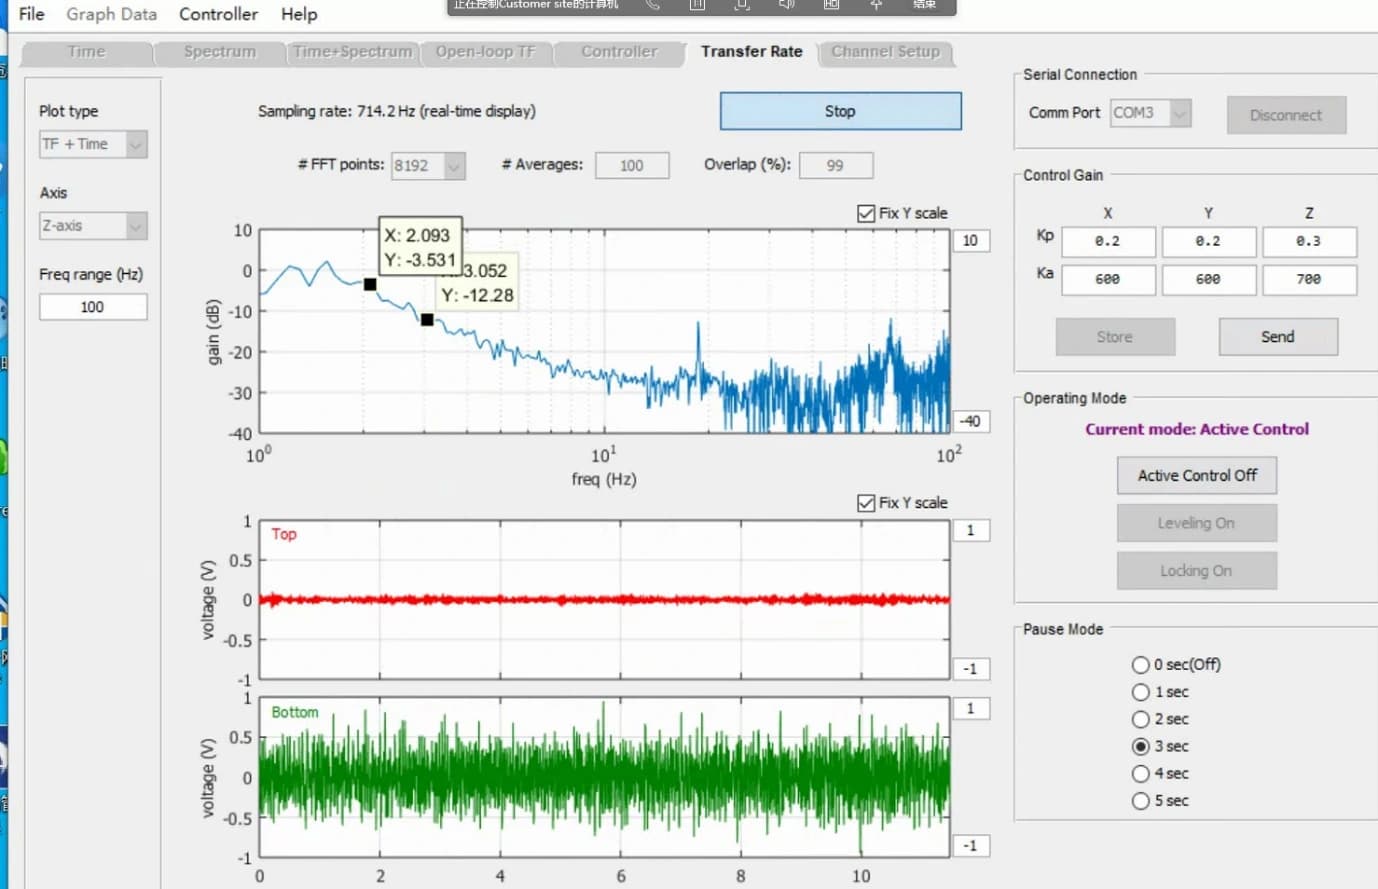
PASSIVE state is good; ACTIVE performance is good at approximately -30 dB near 10 Hz.
For PASSIVE, clean data was obtained on the Z axis via excitation, but horizontal-axis data was not accurate, so the PASSIVE state was estimated by hand-shaking. (See Attachment 1.)
Floor vibration environment measured as vertical B Class, horizontal X E Class, horizontal Y D Class.
With ACTIVE on, the isolator top measured vertical E Class, horizontal X D Class, horizontal Y E Class. (See Attachment 2.)
X-axis top appears worse than base because of the peak at 70 Hz.
Peaks near 70 Hz occur in all directions, attributed to the equipment internal fan. Performance graphs with SEM equipment ON/OFF were compared for verification. (See Attachment 3.)
Equipment image review confirmed that NEMO and the customer are satisfied with the performance.
Special notes (PASSIVE)
Case 1 : With all 8 springs ( Z axis reference )
PASSIVE resonance approximately 12~13 Hz.
ACTIVE maximum performance confirmed at -22 dB.
Case 2 : With 4 springs , see figure below ( Z axis reference )
PASSIVE resonance approximately 5 Hz.
ACTIVE maximum performance confirmed at -35 dB.
Passive spring case diagram (Z axis, 4 springs)
Attachment 1 — Internal program performance measurement result
Z axis (PASSIVE)
Z axis (ACTIVE)
X axis (ACTIVE)
Y axis (ACTIVE)
Attachment 2 — Vibration environment measurement result
Z axis
X axis
Y axis
Attachment 3 — SEM equipment ON/OFF performance comparison
Z Axis — SEM equipment ON
Z Axis — SEM equipment OFF
X Axis — SEM equipment ON
X Axis — SEM equipment OFF
Y Axis — SEM equipment ON
Y Axis — SEM equipment OFF
Share this Case Study
Case Study Information
Related Case Studies
Little Swan UB1000 P6 China Business Trip Report — Zeiss EVO 18 SEM (2018-05-10)
Saeron Technology UB1000 P3 demo result — in-house SEM vibration survey (2016-10-21)