Tier-1 Semiconductor Giheung SR1 Bruker AFM NM-VI DVIA-P4000 Inspection Report
Contents
Overview
Inspection was performed at the Tier-1 Semiconductor Giheung site in response to a request to inspect two installed DVIA-P units.
Daeil UI Program Transmissibility review shows normal performance.
Vibration measurement results show elevated top-plate vibration levels due to equipment IDLE-state vibration.
For accurate inspection, inspection and tuning with the equipment turned off are required.
Prepared for
Tier-1 Semiconductor
System Information
Model: DVIA-P4000
Serial Number: 200805R3
Serial Number (SAC-07): 038847B
Engineer
Youngha Lee, Jongwon Park from DAEIL SYSTEMS
Inspection Date
December 20, 2023
Report written date: December 22, 2023
Date of business trip: December 27–29, 2017
Location
Tier-1 Semiconductor SR1 line, Giheung
Equipment
Bruker AFM NM-VI(NM-6)
Summary of Vibration Results
| Measurement Point | Z-axis (Vertical) 1-10 Hz | Z-axis (Vertical) 12.5-80 Hz | X-axis (Left to Right) 1-10 Hz | X-axis (Left to Right) 12.5-80 Hz | Y-axis (Front to Back) 1-10 Hz | Y-axis (Front to Back) 12.5-80 Hz |
|---|---|---|---|---|---|---|
| Floor | C | C | D | D | D | D |
| Active | E | D | E | D | E | D |
Vibration measurement was performed with the upper equipment in IDLE state.
Z-axis: attenuation is relatively low in the 10–30 Hz band; this is attributed to IDLE-state equipment vibration.
X-axis: in the 15–40 Hz band, top-plate high-frequency vibration exceeds the floor due to IDLE-state equipment vibration.
Y-axis: in the 6–10 Hz and 30 Hz bands, top-plate high-frequency vibration exceeds the floor due to IDLE-state equipment vibration.
For accurate isolator performance evaluation, vibration measurement and tuning with the upper equipment turned off are required.
Data and Image
Displacement Sensor Graph
Accelerometer Graph
Accelerometer and displacement sensors sense vibration changes correctly and operate normally.
Z-axis (Vertical) Transmissibility
With floor excitation, the Daeil UI Program Active Transmissibility graph shows attenuation of −10 dB or more from 3 Hz.
A resonance peak rising to 10 dB at 4.5 Hz is present but is attributed to IDLE-state equipment vibration.
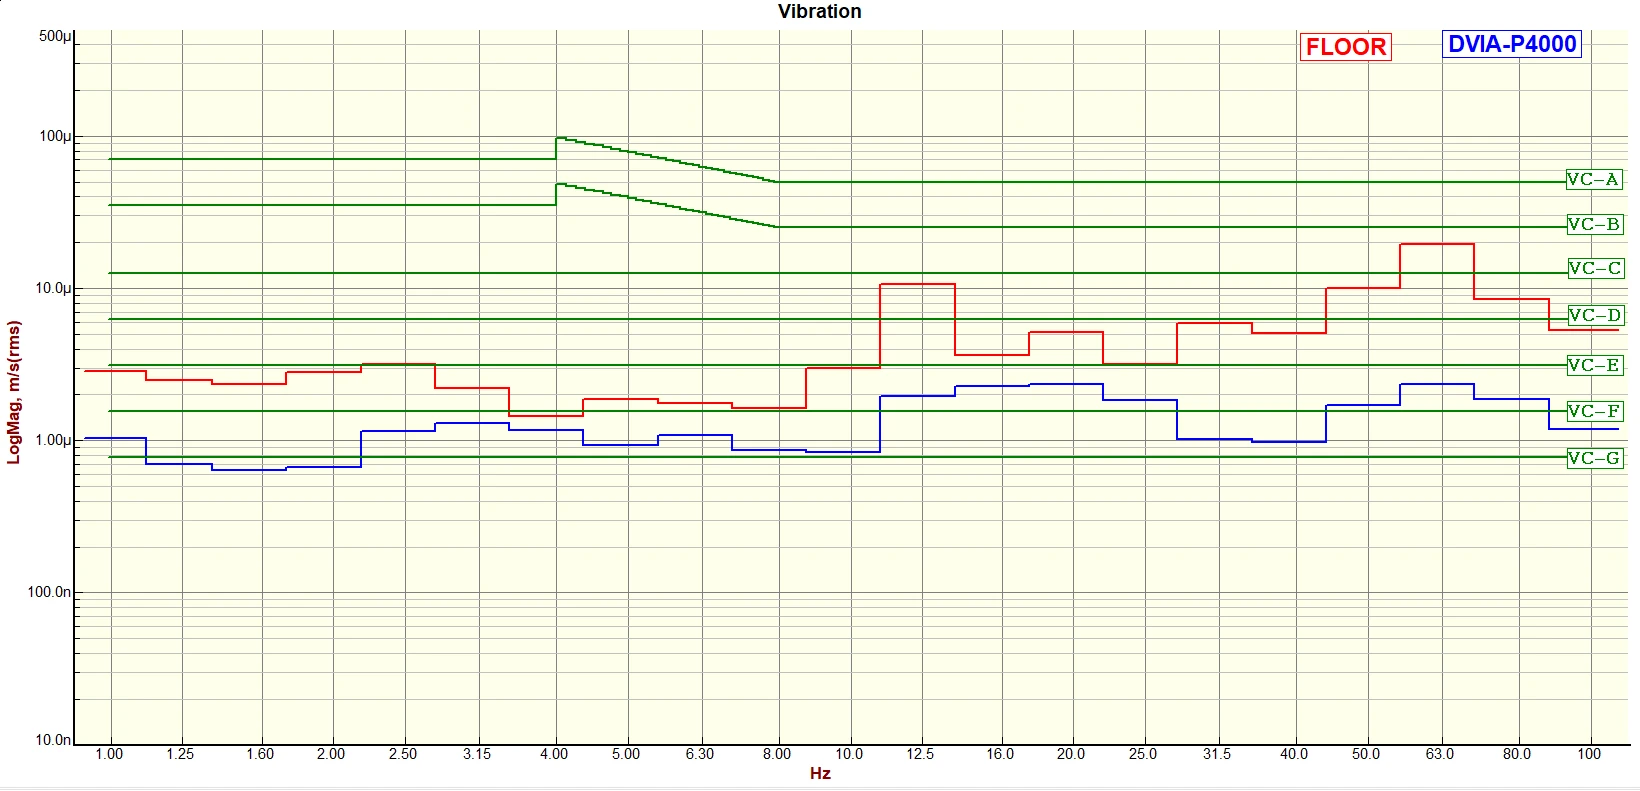
Z-axis (Vertical) VC curves
In the 1–7 Hz low-frequency band, vibration is below VC-G and proportional-motion behavior yields lower attenuation.
In the 10–30 Hz band, attenuation is relatively low; compared with the UI Program graph, operation is correct and this is attributed to IDLE-state equipment vibration.
For accurate isolator performance evaluation, vibration measurement with the upper equipment turned off is required.
X-axis (Left to Right) Transmissibility
The Daeil UI Program Active Transmissibility graph shows attenuation at or below 0 dB from 5 Hz.
Resonance peaks rising to 0 dB at 10, 18, 24, 27, and 36 Hz may be IDLE-state vibration; horizontal-axis excitation is not available to confirm.
For accurate isolator performance evaluation, inspection with the upper equipment turned off is required; additional tuning may improve performance.
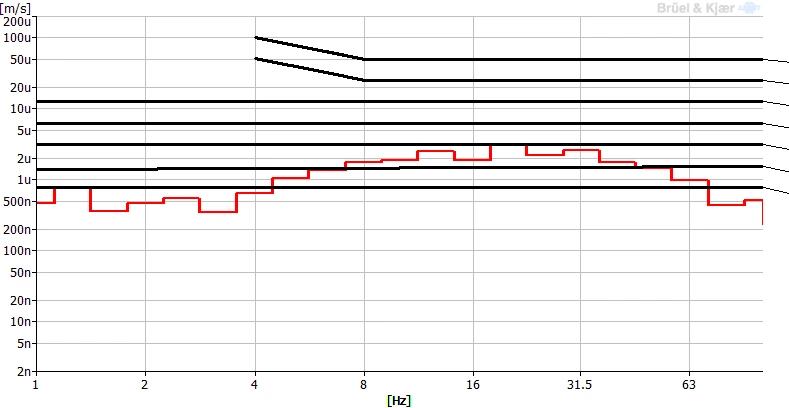
X-axis (Left to Right) VC curves
Vibration attenuation is observed in the 1–10 Hz band.
In the 15–40 Hz band, top-plate vibration exceeds floor vibration.
Resonance peaks in the UI Program Transmissibility graph indicate IDLE-state equipment vibration.
For accurate isolator performance evaluation, vibration measurement with the upper equipment turned off is required.
Y-axis (Front to Back) Transmissibility
The Daeil UI Program Active Transmissibility graph shows attenuation of −10 dB or more from 3 Hz.
Resonance peaks rising to 0 dB at 12 and 32 Hz may be IDLE-state vibration; horizontal-axis excitation is not available to confirm.
For accurate isolator performance evaluation, inspection with the upper equipment turned off is required; additional tuning may improve performance.
Y-axis (Front to Back) VC curves
Vibration attenuation occurs in the 1–6 Hz band. In the 6–10 Hz and 30 Hz bands, top-plate vibration exceeds floor vibration.
Resonance peaks in the UI Program Transmissibility graph indicate IDLE-state equipment vibration.
For accurate isolator performance evaluation, vibration measurement with the upper equipment turned off is required.
Reference
Notes:
1. VC-A/B is measured in 1/3 octave bands from 8-80 Hz, VC-C through VC-G from 1-80 Hz.
2. Detail size refers to line widths in microelectronics manufacturing or particle sizes in medical research.
Share this Case Study
Case Study Information
Related Case Studies
Tier-1 Semiconductor Giheung SR1 BRUKER Photomask Repair System RAVE NM-VI DVIA-P4000 Installation Report
Tier-1 Semiconductor Pyeongtaek P4 3F Line B05 Bruker NM-VI DVIA-P4000 Installation Report
