Lattice Semiconductor Phils ZEISS SEM EVO18 DVIA-U1000 (200203R4) Inspection Report — Philippines — 2024.02
Contents
Prepared for
Lattice Semiconductor
Prepared by
Engineer: Jongwon Park
Inspection date: 24.02.16
Report written date: 24.02.26
Overview
This report provides comprehensive information on the on-site inspection of the DVIA-U1000 measured through the UI program and the vibration measurement device. The data was measured after conducting the repair of the DVIA-U1000, which initially had an issue with the Active button. We placed the accelerometer on the top plate and the bottom plate of the active vibration isolation platform, conducting the vibration measurements in three directions (vertical, left-right, and front-back), with the measurement displayed as VC curve, transmissibility graph, and autospectrum graph.
System Information
Model: DVIA-U1000
Serial Number: 200203R4
Engineer
Jongwon Park from DAEIL SYSTEMS
Inspection Date
February 16, 2024
Location
Lattice Semiconductor 1F Clean room Alabang, Philippines
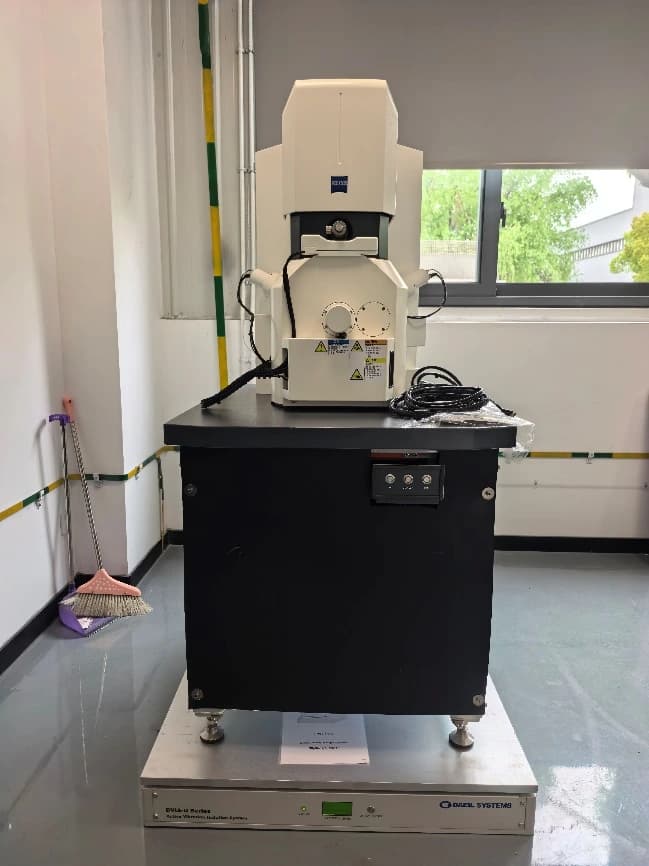
Equipment
ZEISS SEM EVO18
Number of Tuning Trial
1st Inspection
Equipment Condition
Equipment is installed / Turned off
Measurement Device
9.1) Data Physics
Hardware: QUATTRO, Serial Number: 22436
Software: SignalCalc ACE
9.2) Measurement Setting
Bandwidth: 1 – 80 Hz
Lines: 800
Window: Hanning
Averaging: FFT Spectrum Averaging
Engineering Units:
9.3) Accelerometer
PCB Accelerometer
Model: 393B05
Conclusion
Access to the UI program was unavailable during the diagnostic trial. We replaced a DSP board, a communication cable, and an LCD board.
DVIA-U1000 reduced floor vibration in all axes below ZEISS SEM's allowable vibration specification.
Although the floor vibration meets the ZEISS SEM's allowable vibration specification, according to the floor vibration measurements, there is a high chance of potential vibration disturbing the ZEISS SEM in 60 – 70 Hz frequency range. 60 – 70 Hz frequency vibration can be minimized by a passive vibration isolation system; however, a passive vibration isolation system could amplify the floor vibration in 1 – 10 Hz, exceeding the ZEISS SEM's allowable vibration specification.
Summary of Measurements
| Measurement Point | VC curves | VC curves | VC curves | VC curves | VC curves | VC curves |
|---|---|---|---|---|---|---|
| Measurement Point | Z-axis (Vertical) 1-10 Hz | Z-axis (Vertical) 12.5-80 Hz | X-axis (Left to Right) 1-10 Hz | X-axis (Left to Right) 12.5-80 Hz | Y-axis (Front to Back) 1-10 Hz | Y-axis (Front to Back) 12.5-80 Hz |
| Floor | D(✓ Pass) | C(✓ Pass) | E(✓ Pass) | E(✓ Pass) | F(✓ Pass) | F(✓ Pass) |
| Active | F(✓ Pass) | G(✓ Pass) | F(✓ Pass) | G(✓ Pass) | F(✓ Pass) | G(✓ Pass) |
ZEISS EVO18 Allowable Vibration Spec
ZEISS EVO18 Allowable Vibration Spec VC-Curve (rms Velocity, m/s Graph)
Data and Image
UI Program Transmissibility
Z-axis (Vertical) Transmissibility
The transmissibility indicates that -14.9 dB (82%) vibration reduction at 4 Hz and -21.35 dB (91%) vibration reduction at 10 Hz.
X-axis (Left to Right) Transmissibility
The transmissibility indicates that -16.46 dB (85%) vibration reduction at 4 Hz and -26.05 dB (85%) vibration reduction at 10 Hz.
Y-axis (Front to Back) Transmissibility
The transmissibility indicates that -18.94 dB (88%) vibration reduction at 4 Hz and -26.06 dB (95%) vibration reduction at 10 Hz.
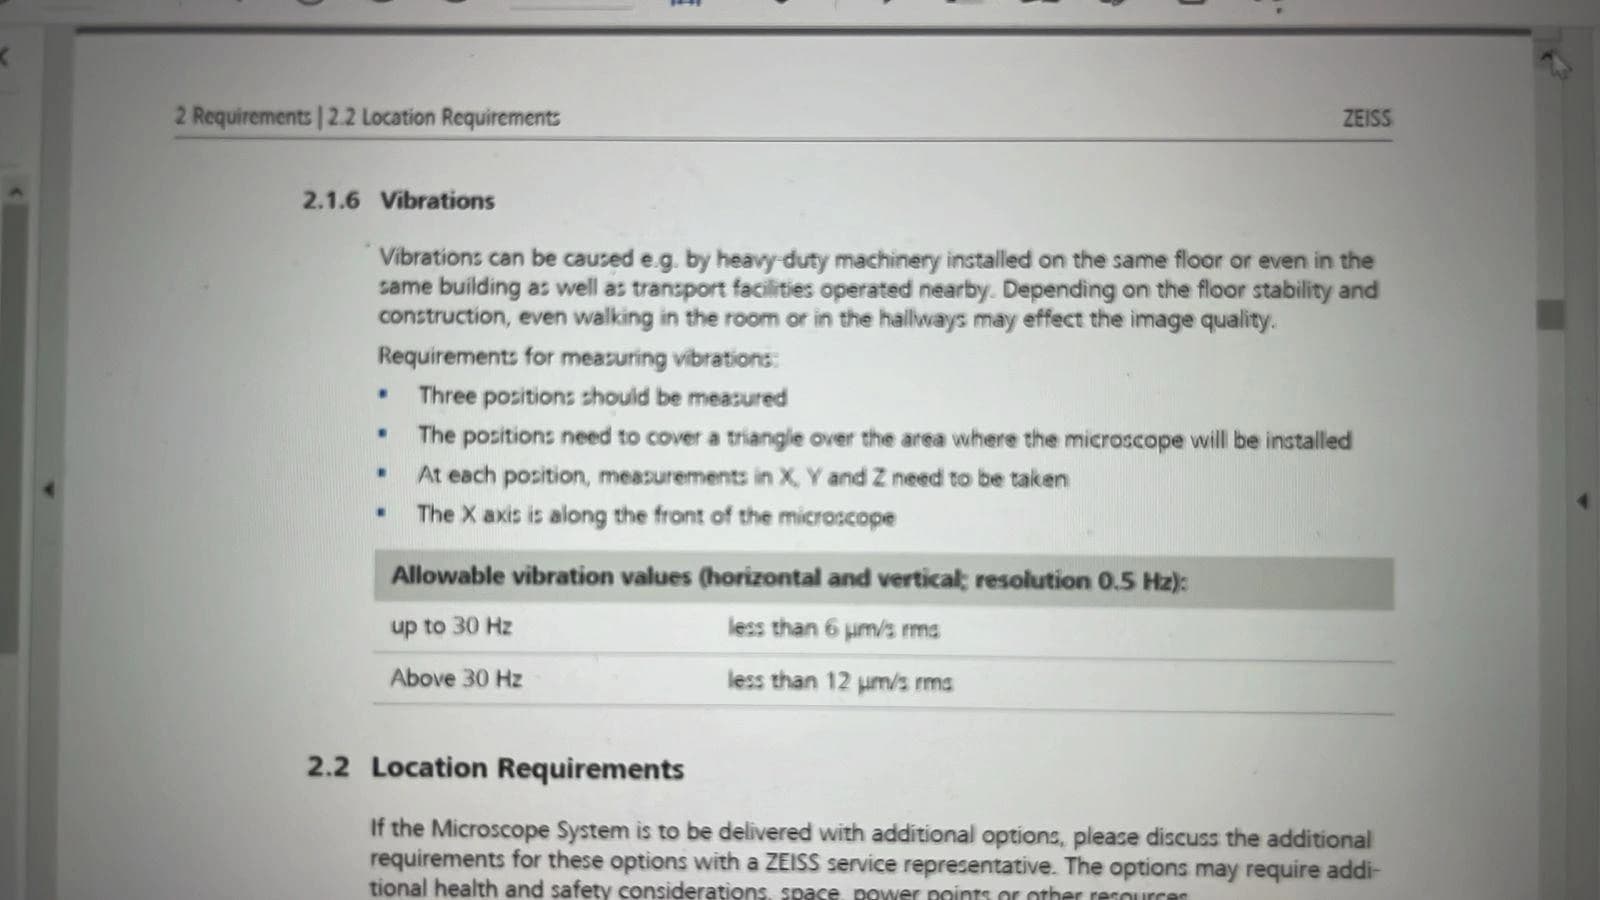
12.2 Vibration Measurement
Z-axis (Vertical) VC Curve
The DVIA-U1000 reduced vibration from VC-D (4.79E-06) to VC-F (1.32E-06) at 1 Hz, and from VC-C (1.20E-05) to VC-G (3.20E-07) at 63 Hz.
Z-axis (Vertical) Autospectrum Graph
X-axis (Left to Right) VC Curve
The DVIA-U1000 reduced vibration from VC-E (1.88E-06) to VC-F (1.06E-06) at 1 Hz, and from VC-E (1.58E-06) to VC-G (3.39E-07) at 63 Hz.
X-axis (Left to Right) Autospectrum Graph
Y-axis (Front to Back) VC Curve
The DVIA-U1000 reduced vibration from VC-F (1.29E-06) to VC-F (9.69E-07) at 1.75 Hz, and from VC-E (1.58E-06) to VC-G (3.39E-07) at 63 Hz.
Y-axis (Front to Back) Autospectrum Graph
Data Physics QUATTRO Vibration Measurement Device Transmissibility Graph
Transmissibility = Output / Input
The transmissibility graph is not a smooth curve because there was not enough floor vibration(input).
Reference
Generic Vibration Criteria
*Notes:*
- As measured in one-third octave bands over 8-80 Hz (VC-A/B) or 1-80 Hz (VC-C through VC-G).
- Detail size refers to width in microelectronics fabrication or particle size in medical research.
Share this Case Study
Case Study Information
Related Case Studies
Lattice Semiconductor ZEISS SEM EVO18 DVIA-U1000 Inspection Report

Lattice Semiconductor Phils ZEISS EVO 18 DVIA-U1000 (200203R4 · P15) Remote tuning — Philippines — 2020.10.08