Korea Institute of Science and Technology (L7-222) Olympus BX51 DVIA-UD350 (220127R1-2) Installation Report
Contents
Author
Engineers: Chaewon Lee, Jonghwa Seo
Measurement Date
December 23, 2024
Report Written Date
December 31, 2024
Overview
Image fluctuation occurred on the DVIA-UD350 installed at Korea Institute of Science and Technology Building L7, Room 222; inspection and tuning were performed.
After equipment placement, vibration measurement and tuning were performed with the equipment Turned off.
DVIA-UD350 inspection found an anomaly on the Y1 sensor; sensor replacement was performed.
Data are presented as VC curves, and reference material on vibration levels is provided.
Vibration Isolation Platform
Model: DVIA-UD350
Serial Number: 220127R1-2
Engineer
DAEIL SYSTEMS field engineers Chaewon Lee, Jonghwa Seo
Installation Site
Korea Institute of Science and Technology L7, Room 222
End User
Korea Institute of Science and Technology L7, Room 222
Customer Equipment
Manufacturer: Olympus
Equipment: Microscope
Model: BX51
Equipment Vibration Specification
Not supplied by the customer / verification not possible
Equipment Status
장비 설치 및 turned off
Measuring Equipment
10.1) Data Physics DAQ
-Hardware: QUATTRO, Serial Number: 22436
-Software: SignalCalc ACE
10.2) Accelerometer
PCB Accelerometer
Model: 393B05
Vibration Measurement Setup
Bandwidth: 200 Hz
Lines: 3200
Averaging: FFT Spectrum Averaging
Engineering Units: m/s
Window: Hanning
Average Mode: Exponential, 40
Conclusion
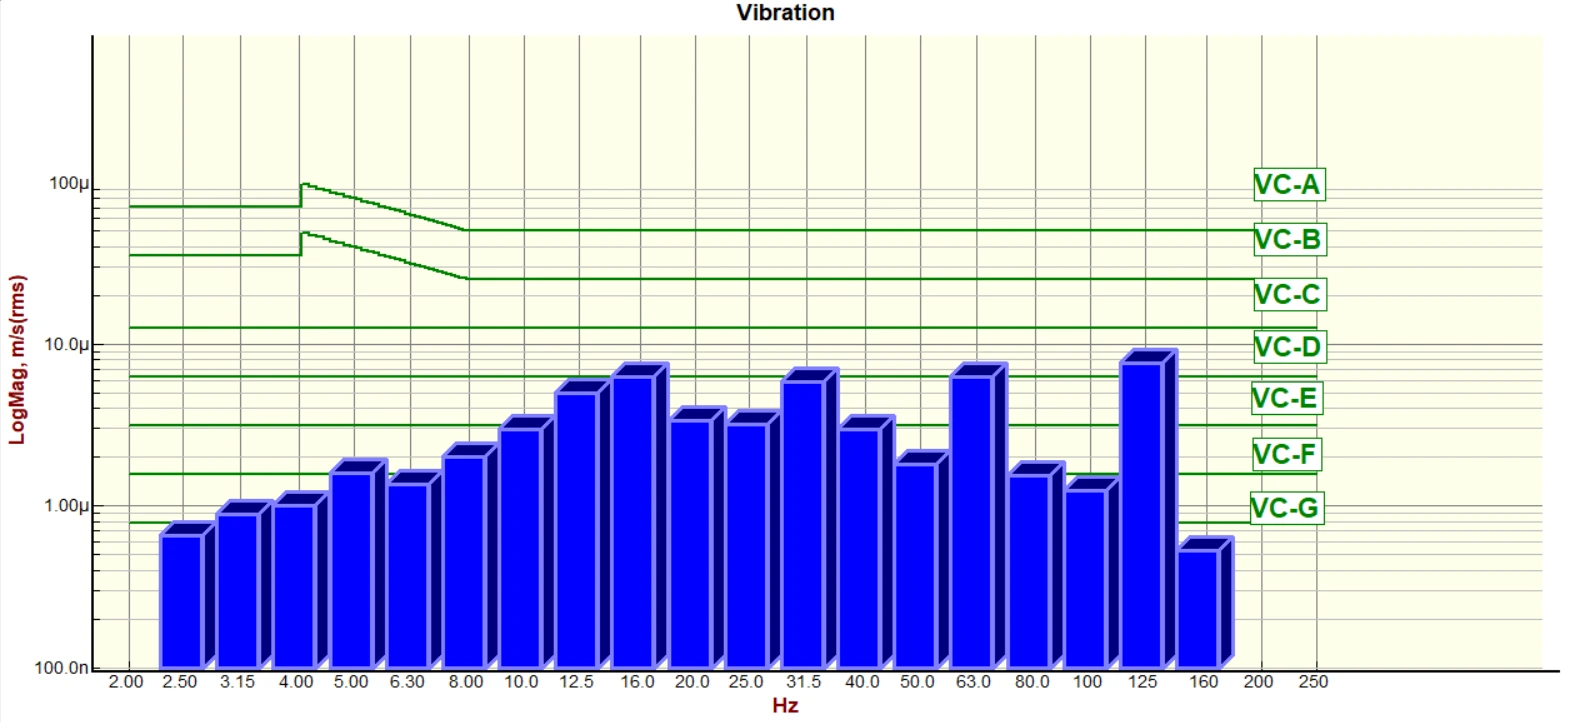
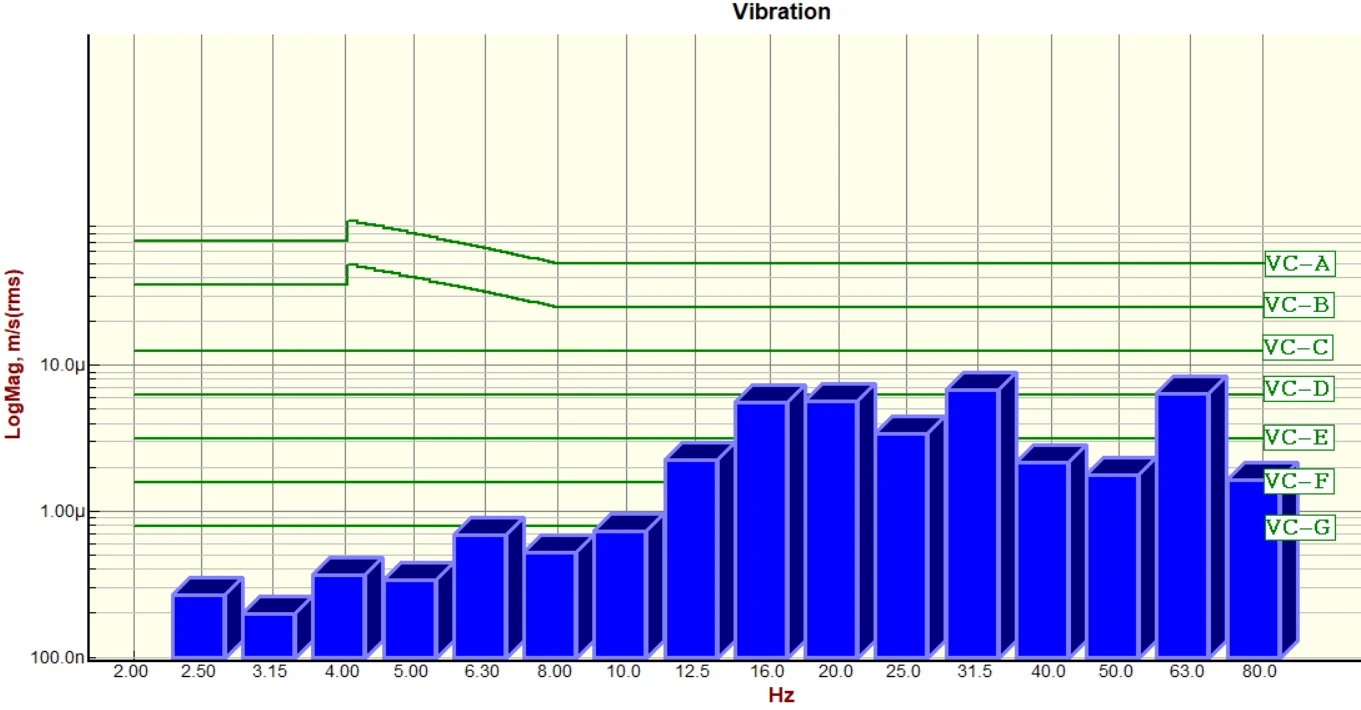
VC-G, the lowest vibration level in the criterion set, is measured in every direction and across all bands.
Measurement Data
| Place of measurement | State | Direction | Floor | DVIA-UD350 |
|---|---|---|---|---|
| Korea Institute of Science and Technology L7, Room 222 1. Floor 2. DVIA-UD350 | 장비 Turned off | Vertical | VC-C @ 31.5 Hz | VC-G @ 31.5 Hz |
| Left to Right | VC-F @ 31.5 Hz | VC-G @ 31.5 Hz | ||
| Front to Back | VC-E @ 1 Hz | VC-G @ 1 Hz |
Data and Image
Vertical VC Curves
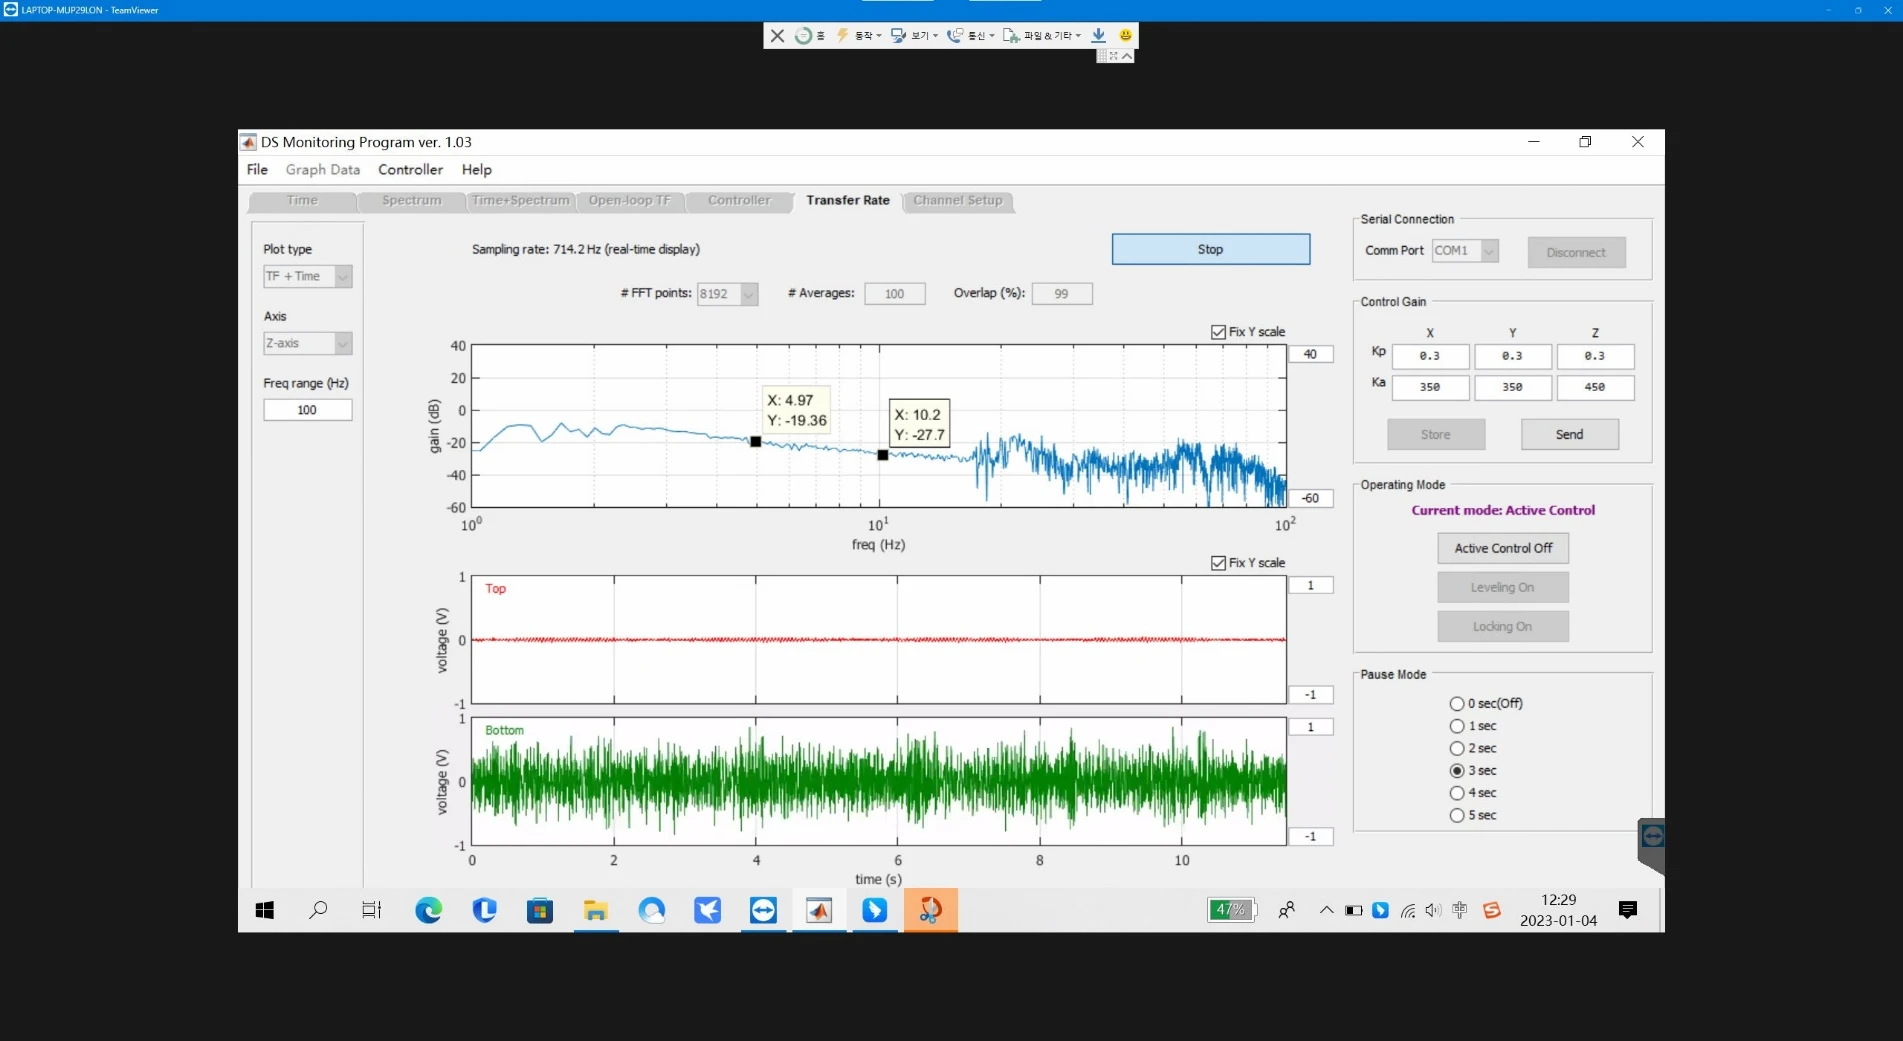
Vertical Autospectrum
Vertical Transmissibility
Left to Right VC Curves
Left to Right Autospectrum
Left to Right Transmissibility
Front to Back VC Curves
Front to Back Autospecturm
Front to Back Transmissibility
Reference
Notes:
1. VC-A/B is measured in 1/3 octave bands from 8-80 Hz, VC-C through VC-G from 1-80 Hz.
2. Detail size refers to line widths in microelectronics manufacturing or particle sizes in medical research.
Share this Case Study
Case Study Information
Related Case Studies
Korea Institute of Science and Technology (KIST) Microscope DVIA-UD350 (220127R1-2) Installation Report
KIST Olympus IX51 DVIA-UD350-1008M (221004R2) Installation Report